Value Distribution
Value Distribution shows how company values are showing up in real feedback across the selected reporting line.
It helps you move values from posters into visible day-to-day recognition.
What you can do here
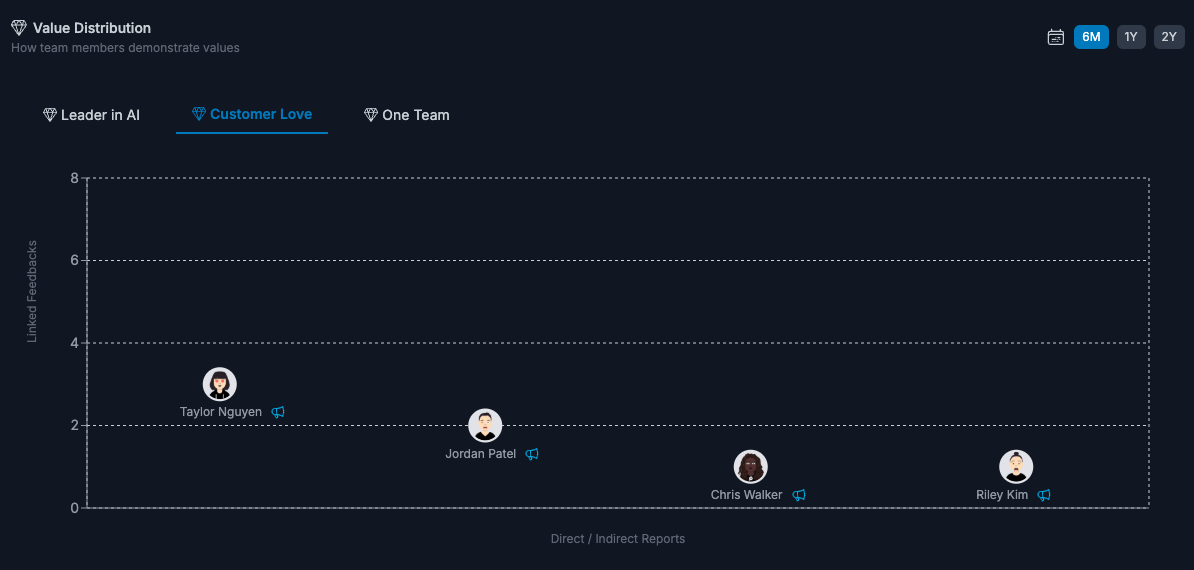
- switch between values as tabs
- review who is most recognized per value
- change timeframe to 6M, 1Y, or 2Y
- open a person directly in line report details
- trigger a highlight from the chart to recognize value-led behavior
Why this matters for Leaders and HR
This is one of the clearest ways to see whether culture is actually visible in daily work, not just documented. It helps you spot both reinforcement opportunities and blind spots across leader trees.
Managers can use it too for their own reporting line.
If you are a workspace owner, select a leader first so the chart knows which reporting line to analyze.
When Value Distribution is most useful
Use Value Distribution when you want to answer questions like:
- Which values are already visible in real work?
- Which values are being reinforced unevenly?
- Where should we be more intentional about recognition?
Use it as a culture signal, not as a scoreboard.
How to read this view well
- high activity in one value often means that behavior is consistently visible and tagged
- low activity can mean either a true behavior gap or inconsistent value tagging in feedback
- each plotted person reflects how much tagged feedback they received for that value in the selected timeframe
Use the chart as a conversation starter, then validate in context before concluding.
Make this useful every week
- Select one value to reinforce this week.
- Recognize visible examples publicly.
- Check whether underrepresented values need clearer behavioral expectations.
Prerequisites
For this view to be useful:
- company values should be published
- feedback should include value tagging
Without those, charts may appear sparse even when work quality is strong.
Important but easy to miss
- Timeframe changes can materially change who appears as highly recognized.
- Strong recognition concentration in a small group may indicate uneven visibility, not necessarily low contribution from others.
- Highlight triggers are great for reinforcement, but keep recognition specific to observed behavior.
Common mistakes
- assuming low-value activity automatically means the behavior is absent
- treating tagged recognition volume as a complete measure of contribution
- recognizing a value in generic terms instead of pointing to visible behavior
- forgetting that this view depends on tagging discipline as well as real behavior
FAQs
Can I use this if values are set up but nobody tagged them in feedback?
You can open the view, but it will likely be sparse or empty until values are actually linked in feedback.
Does a low-count value always mean the behavior is missing?
No. It can also mean value-tagging is inconsistent, so validate before concluding there is a real culture gap.